Rust on BBC micro:bit - hardware debugging
Ok Time to play with debugging Rust code running on BBC micro:bit.
Simple debug session
For connecting to the board, on my Mac, I’ve installed OpenOCD with:
brew install openocd
Checking version installed:
openocd --version

Open On-Chip Debugger 0.10.0
Licensed under GNU GPL v2
For bug reports, read
    http://openocd.org/doc/doxygen/bugs.html
Also, checking if the board is visible:
...
Then, I could start the debugger:
openocd -f interface/cmsis-dap.cfg -f target/nrf51.cfg

Open On-Chip Debugger 0.10.0
Licensed under GNU GPL v2
For bug reports, read
    http://openocd.org/doc/doxygen/bugs.html
Info : auto-selecting first available session transport "swd". To override use 'transport select <transport>'.
cortex_m reset_config sysresetreq
adapter speed: 1000 kHz
Info : CMSIS-DAP: SWD  Supported
Info : CMSIS-DAP: Interface Initialised (SWD)
Info : CMSIS-DAP: FW Version = 1.0
Info : SWCLK/TCK = 1 SWDIO/TMS = 1 TDI = 0 TDO = 0 nTRST = 0 nRESET = 1
Info : CMSIS-DAP: Interface ready
Info : clock speed 1000 kHz
Info : SWD DPIDR 0x0bb11477
Info : nrf51.cpu: hardware has 4 breakpoints, 2 watchpoints
Then in another console I’ve simply tried to connect to it and debug:
arm-none-eabi-gdb target/thumb6m-none-eabi/microbit-blinky

....
(gdb) target remote localhost:3333
(gdb) load
(gdb) continue
The final continue makes programm running, slow though.
Using Visual Studio Code
Finally, I’ve decided to try Visual Studio Code with the following extensions installed, as an IDE with a hardware debugger support:
- Rust (rls) 0.4.7
- Cortex-Debug 0.1.21
The nice thing about the Cortex Debug plugin is that is launches both OpenOCD and GDB at the same time behind the scenes, so number of steps required to be performed from within IDE is down to absolute minimum.
This is the launch config file created for debugging on my machine:
{
    // Use IntelliSense to learn about possible attributes.
    // Hover to view descriptions of existing attributes.
    // For more information, visit: https://go.microsoft.com/fwlink/?linkid=830387
    "version": "0.2.0",
    "configurations": [
        {

            "cwd": "${workspaceRoot}",
            "executable": "${workspaceRoot}/target/thumbv6m-none-eabi/debug/microbit-blinky",
            "name": "Debug Microcontroller",
            "request": "launch",
            "type": "cortex-debug",
            "servertype": "openocd",
            "configFiles": [
                "interface/cmsis-dap.cfg",
                "target/nrf51.cfg"
            ],
            "armToolchainPath": "/Users/adam/programs/gcc-arm-none-eabi/bin"
        }
    ]
}
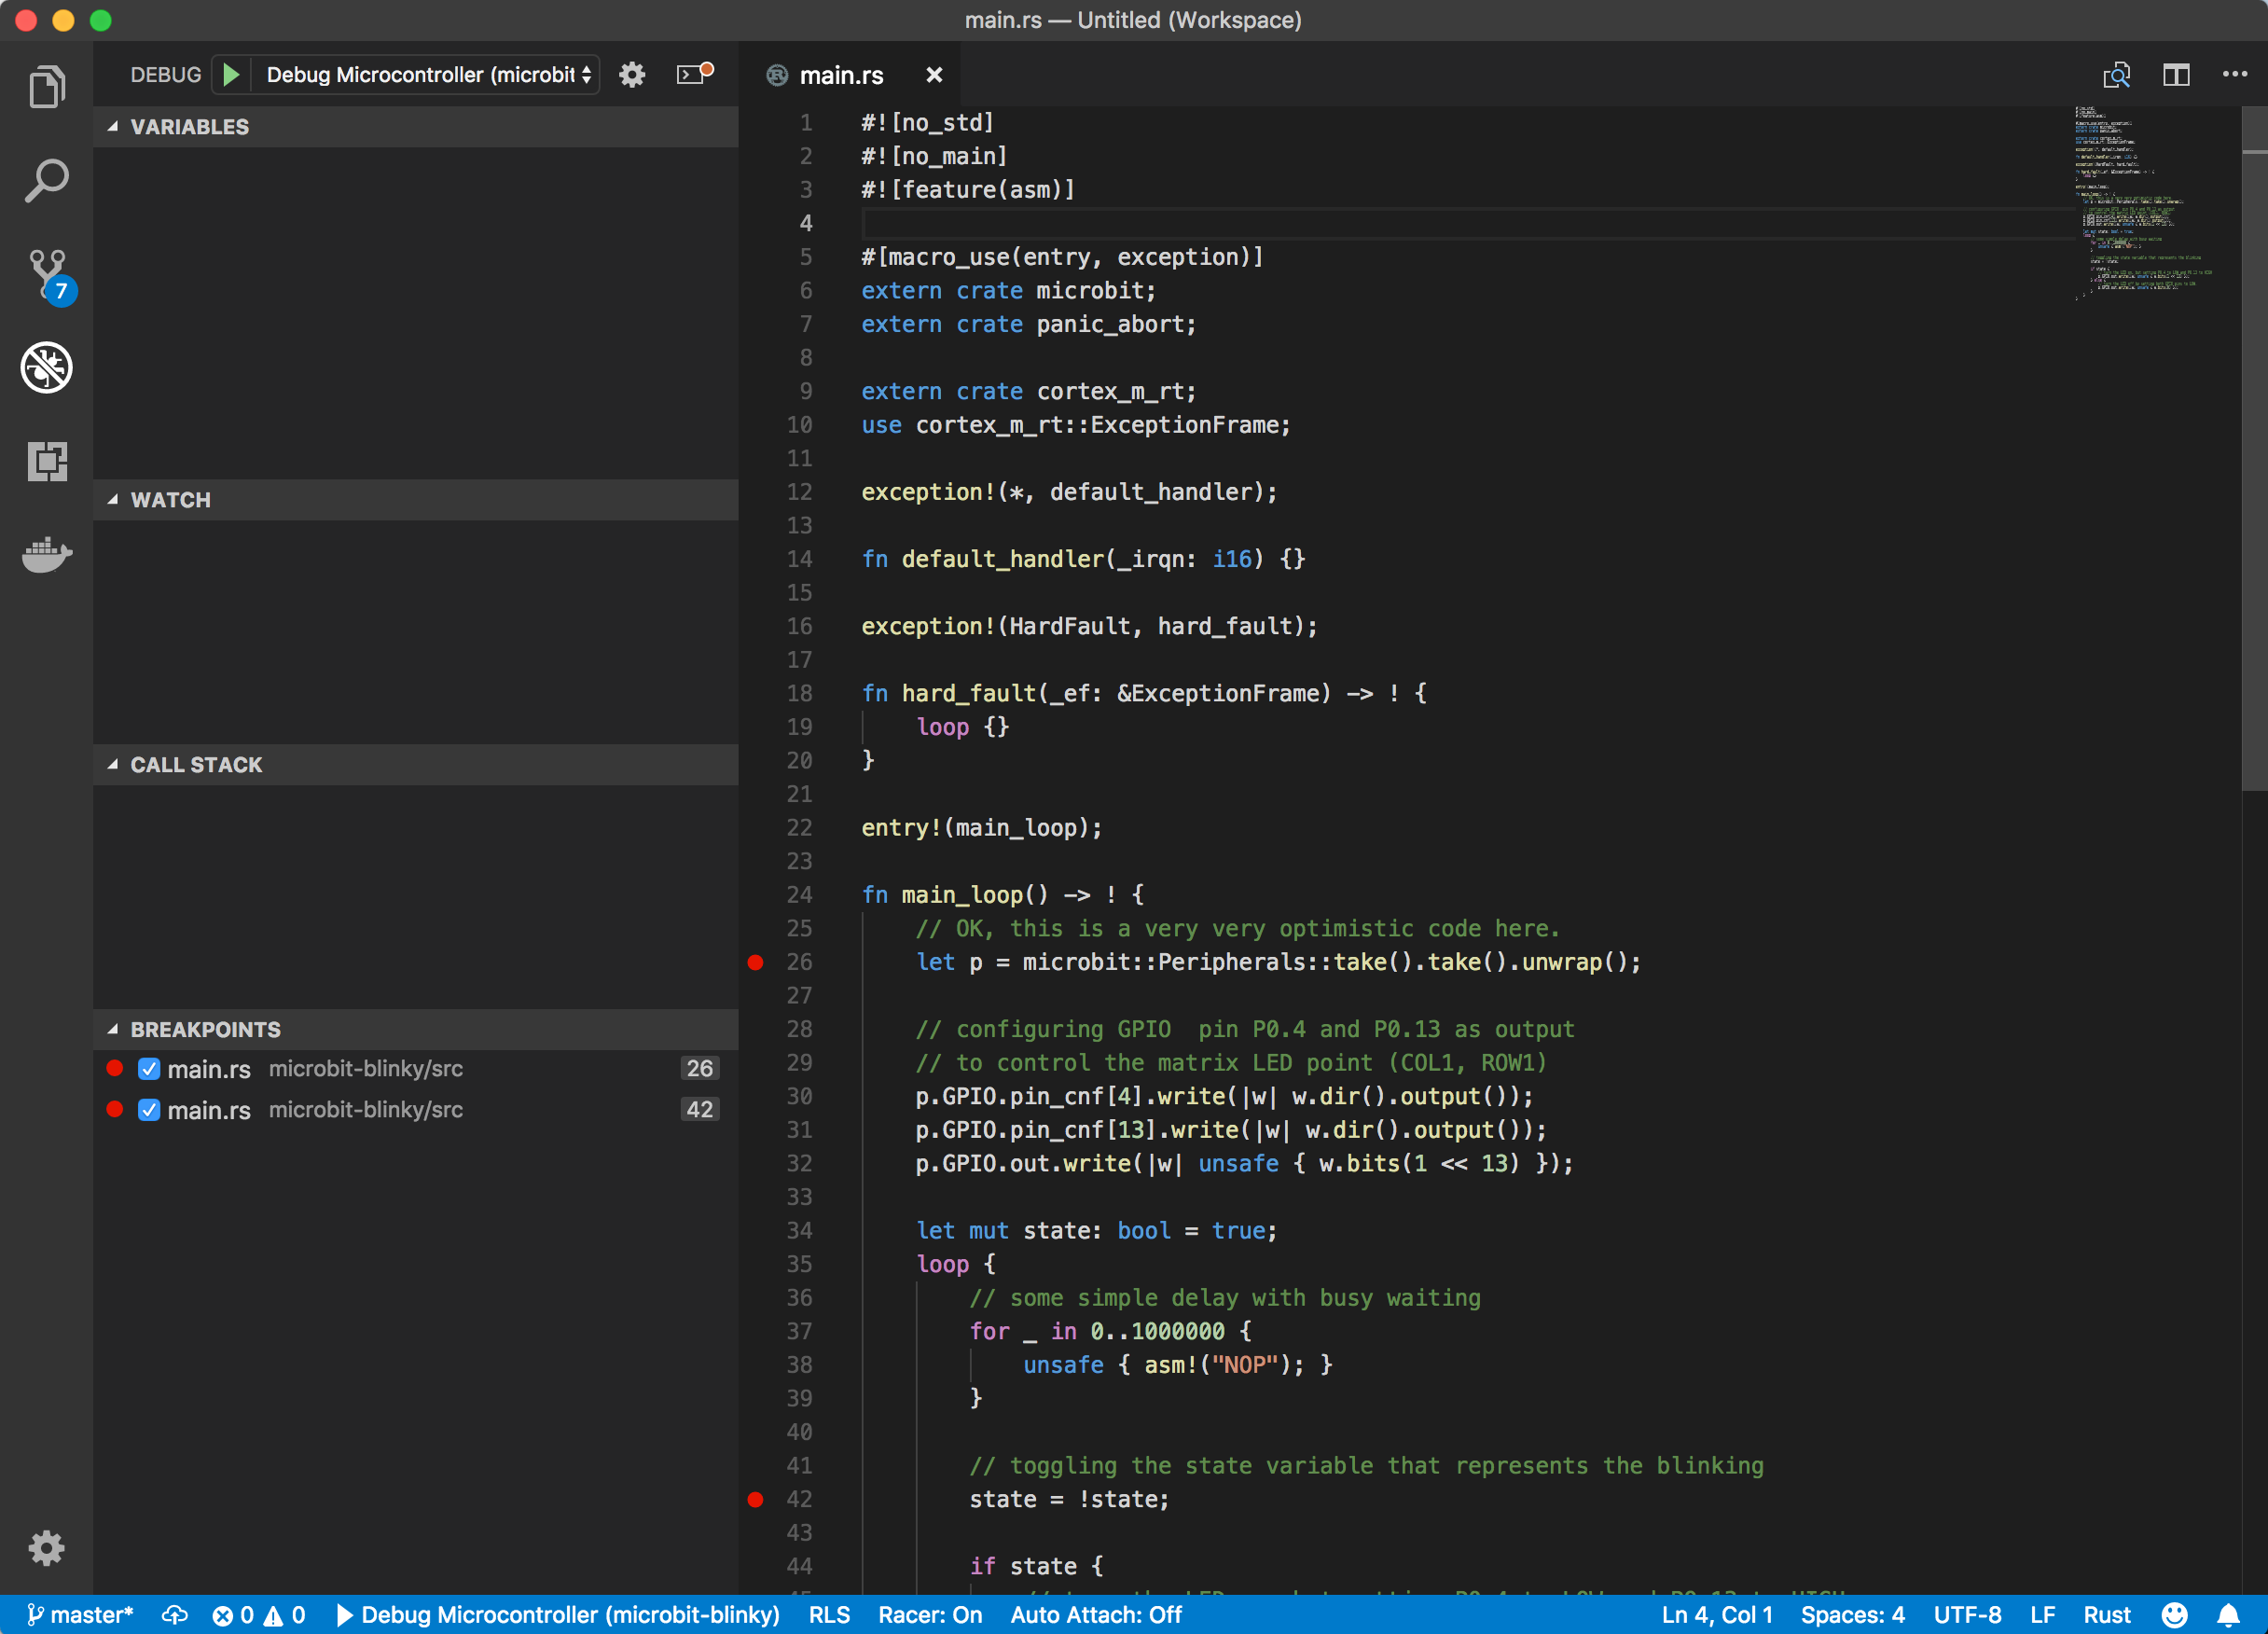
Then, I’ve put two breakpoints in my main.rs file (lines 26 and 42) using F9 key:
Then, after starting the debugger (with F5) I could see the executions stopped at fn Reset() function in lib.rs of Cortex-m runtime.
Pressing F5 again continues and eventually I have my breakpoints in my main.rs reached:
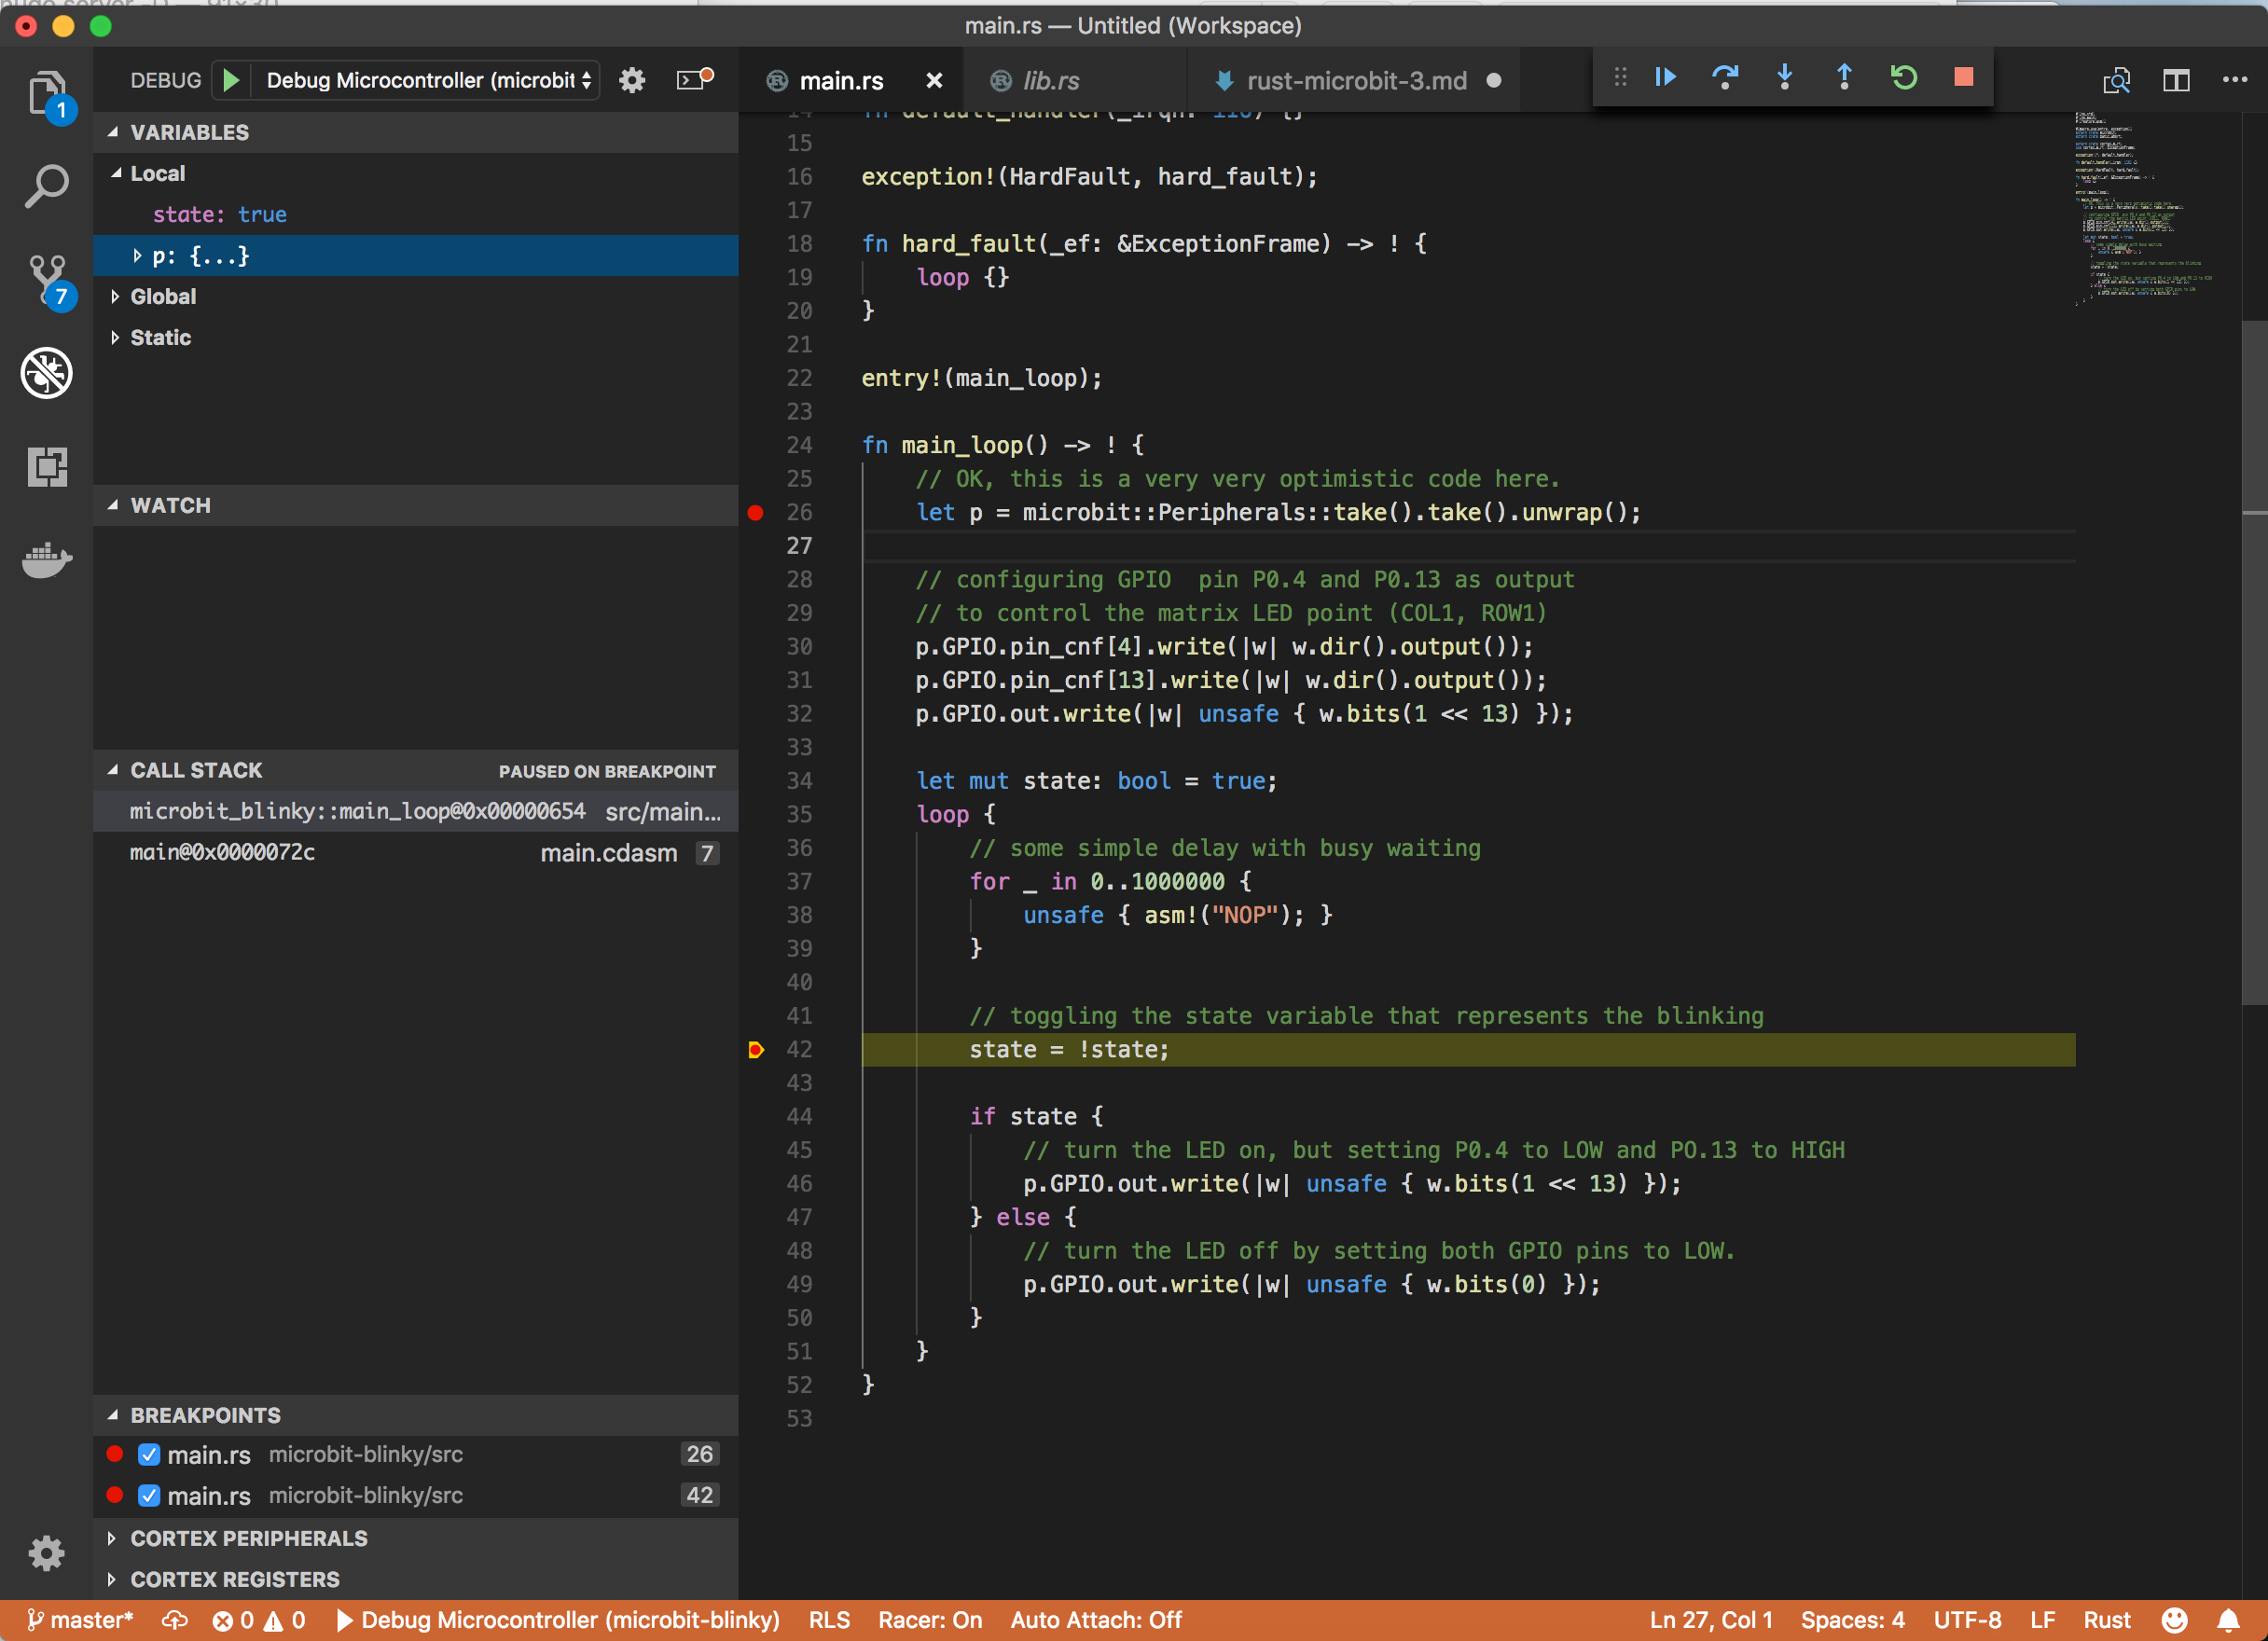
I can inspect variables, call stack as well as Cortex-M registers.
Pretty neat!