C++ and BBC micro:bit - part 3
Now, lets try to have some more serious experience, and let’s see how we can debug it.
I have found some guidelines on how-to prepare my environment for debugging micro:bit devices on this handbook page. However, they were quite low-level, involving command line control of GDB and I must admit this is not the way I prefer to look at things.
I’ve decided to give it a go and use Eclipse CDT to get a sample code running on micro:bit examined.
Tools required
To get the micro:bit debug’able, the installation step for the Linux box I’m using (Ubuntu 16.06) was pretty much this:
pip install --pre -U pyocd
The toolchain installed initially for ARM targets (comes with proper DGB (arm-none-eabi-gdb) shipped. That should be sufficient.
I’ve also decided to use Eclipse CDT (I’m using Neon.2 release) to have some IDE where I can set up my preferred workspace. For that a C/C++ GDB Hardware Debugging component has to be installed on top of default CDT installation.
Together with microbit-samples repository and the build system as investigated previously, I should be able to plug things together and do some simple debugging.
Building for debugging
One thing has to be addressed first - the optimisation level. By default, yotta configures the build for the release configuration, with GCC invoked with -Os flag. Such a nice optimisation level obviously will offer a very little chance to get some proper debugging experience.
All we have to do to change that, is start running build with:
yotta build --debug-build
So simple. However, there is a catch. Apparently not everything works out-of-the-box at the moment, and when you do that, you’ll get the compilation error:
...
/home/adam/workingCopies/microbit-samples/yotta_modules/nrf51-sdk/source/nordic_sdk/components/libraries/bootloader_dfu/bootloader_util.c: In function 'bootloader_util_reset':
/home/adam/workingCopies/microbit-samples/yotta_modules/nrf51-sdk/source/nordic_sdk/components/libraries/bootloader_dfu/bootloader_util.c:126:1: error: r7 cannot be used in asm here
 }
 ^
[66/164] Building C object ym/nrf51-sdk/source/CMakeFiles/nrf51-sdk.dir/home/adam/workingCop..._modules/nrf51-sdk/source/nordic_sdk/components/libraries/bootloader_dfu/dfu_app_handler.c.o
ninja: build stopped: subcommand failed.
Googling for help revels that this seems to be a known problem and the solution for that is to add -fomit-frame-pointer to compile flags.
To do that, I’m visiting yotta_targets/mbed-gcc/CMake/Platform/mbedOS-GNU-C.cmake file and changed CMake’s debug related compiler flags there, so the lines 21 and up looked like this afterwards:
set(CMAKE_C_FLAGS_DEBUG_INIT          "-g -gdwarf-3 -fomit-frame-pointer")
set(CMAKE_C_FLAGS_MINSIZEREL_INIT     "-Os -DNDEBUG")
set(CMAKE_C_FLAGS_RELEASE_INIT        "-Os -DNDEBUG")
set(CMAKE_C_FLAGS_RELWITHDEBINFO_INIT "-Os -g -gdwarf-3 -DNDEBUG")
set(CMAKE_INCLUDE_SYSTEM_FLAG_C "-isystem ")


set(CMAKE_ASM_FLAGS_DEBUG_INIT          "-g -gdwarf-3 -fomit-frame-pointer")
set(CMAKE_ASM_FLAGS_MINSIZEREL_INIT     "-Os -DNDEBUG")
set(CMAKE_ASM_FLAGS_RELEASE_INIT        "-Os -DNDEBUG")
set(CMAKE_ASM_FLAGS_RELWITHDEBINFO_INIT "-Os -g -gdwarf-3 -DNDEBUG")
set(CMAKE_INCLUDE_SYSTEM_FLAG_ASM  "-isystem ")
Then I’ve removed the entire build directory and tried again:
yotta build --debug-build
This time with no issues.
Setting up project in Eclipse
Eclipse does not have built-in support for micro:bit nor yotta, nor there is to my knowledge any Eclipse plug-in project that brings the out-of-box support for it. The microbit-samples repository can be imported as pretty generic type of project: Existing Code as Makefile Project.
In project Properties, on the C/C++ Build options, we can change default build command from make to yotta build --debug-build.

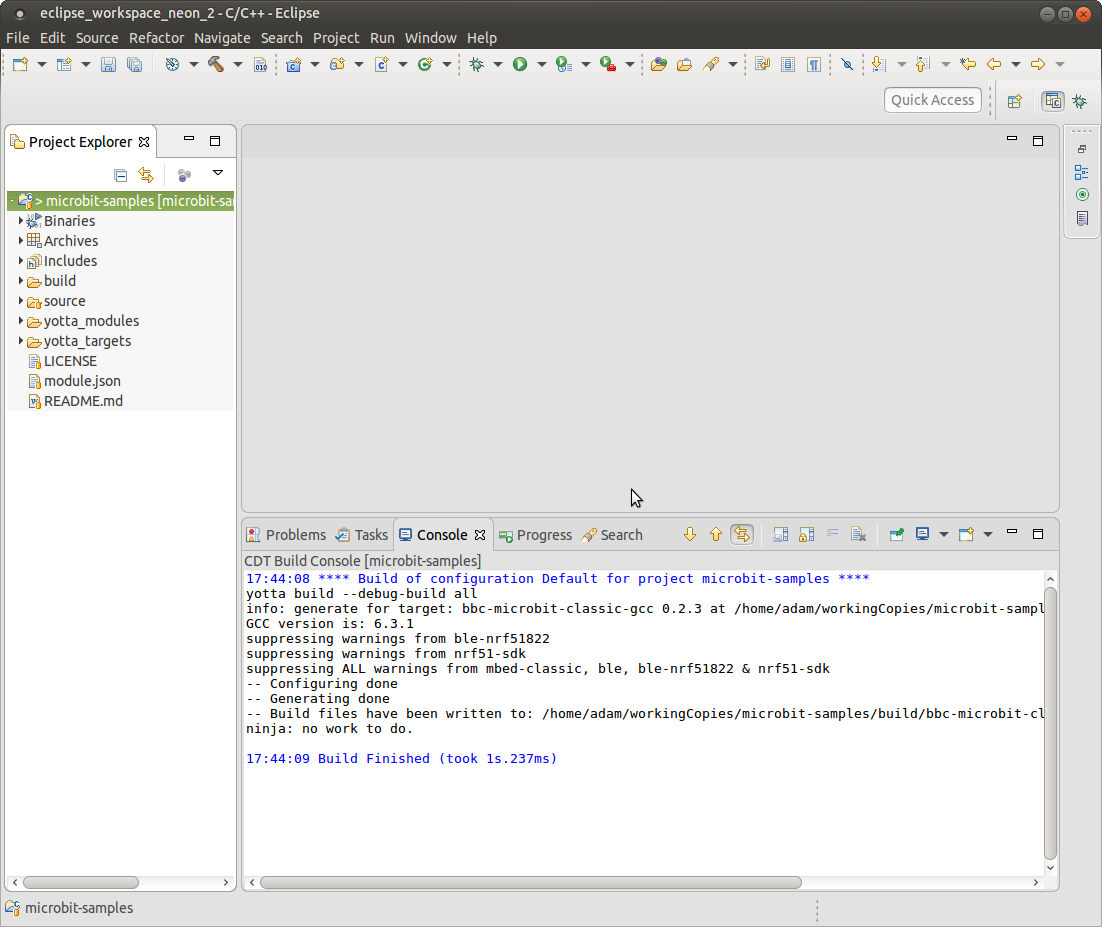
Starting the build (e.g. Ctrl+B) results with success:

For a project imported this way, Eclipse knows a little too less in order to properly interpret our code, and one of the symptoms is Eclipse’s Code Analysis agent going crazy about some perfectly valid lines of code marking them as errors. The simplest option is to turn it off for the moment, by visiting project Properties and then C/C++ General->Code Analysis page, switching to Use project settings and un-select all the checkboxes there.
Time for a debug session
I’ve connected micro:bit to PC and then from a console started the GDB server:
pyocd-gdbserver --persist -t nrf51 -bh -r
Just to verify its all running and accessible for the gdb over port 3333, I’ve made a simple check:
arm-none-eabi-gdb
(gdb) target remote :3333
… and nothing, but timeout. OK, something is missing, however the pyocd displayed no error, no warning…
I suspect permissions, so I’ve decided to make a quick check, by running pyocd server with root privileges:
sudo /home/adam/.local/bin/pyocd-gdbserver --persist -t nrf51 -bh -r
Note that I had to give the full path where pip has installed it (in my home directory, then .local etc), otherwise it was not resolvable for root. This time I got some promising output confirming that things are spinning:
INFO:root:DAP SWD MODE initialised
INFO:root:ROM table #0 @ 0xf0000000 cidr=b105100d pidr=2007c4001
INFO:root:[0]<e00ff000: cidr=b105100d, pidr=4000bb471, class=1>
INFO:root:ROM table #1 @ 0xe00ff000 cidr=b105100d pidr=4000bb471
INFO:root:[0]<e000e000:SCS-M0+ cidr=b105e00d, pidr=4000bb008, class=14>
INFO:root:[1]<e0001000:DWT-M0+ cidr=b105e00d, pidr=4000bb00a, class=14>
INFO:root:[2]<e0002000:BPU cidr=b105e00d, pidr=4000bb00b, class=14>
INFO:root:[1]<f0002000: cidr=b105900d, pidr=4000bb9a3, class=9, devtype=13, devid=0>
INFO:root:CPU core is Cortex-M0
INFO:root:4 hardware breakpoints, 0 literal comparators
INFO:root:2 hardware watchpoints
INFO:root:Telnet: server started on port 4444
INFO:root:GDB server started at port:3333
One line worth having a look is with this: INFO:root:4 hardware breakpoints - means we will be able to put up to 4 HW breakpoints. Good to know.
All right, let’s go back and verify what GDB is saying about it…
arm-none-eabi-gdb
(gdb) target remote :3333
Remote debugging using :3333
warning: No executable has been specified and target does not support
determining executable automatically.  Try using the "file" command.
0x000181ca in ?? ()
(gdb)
OK, looks good too. We’ll make Eclipse taking care of providing proper informations about images to load.
BTW: there is a simple solution for configuring udev system on the Ubuntu so that running GDB server with root as I did above is no longer required, but to move quickly forward, I leave that as is for the very now.
Then, switching back to Eclipse.
At this point I’ve added breakpoint at the first instruction in the main() function.
Then from main menu Run->Debug Configurations.... I’ve created new entry for GDB Hardware Debugging type that looked like this on the Main tab:

and like this on the Debugger tab:

and like this on the Startup tab:

The important bit on the last tab is to in Load Image and Symbols group, under Load image, switch to option Use file and point to:
${workspace_loc:/microbit-samples/build/bbc-microbit-classic-gcc/source/microbit-samples-combined.hex}
which is the image we want the GDB to be taking for programming the flash memory, while at the same time, under Load symbols leave the Use program binary: (blah blah blah..) option with its defaults.
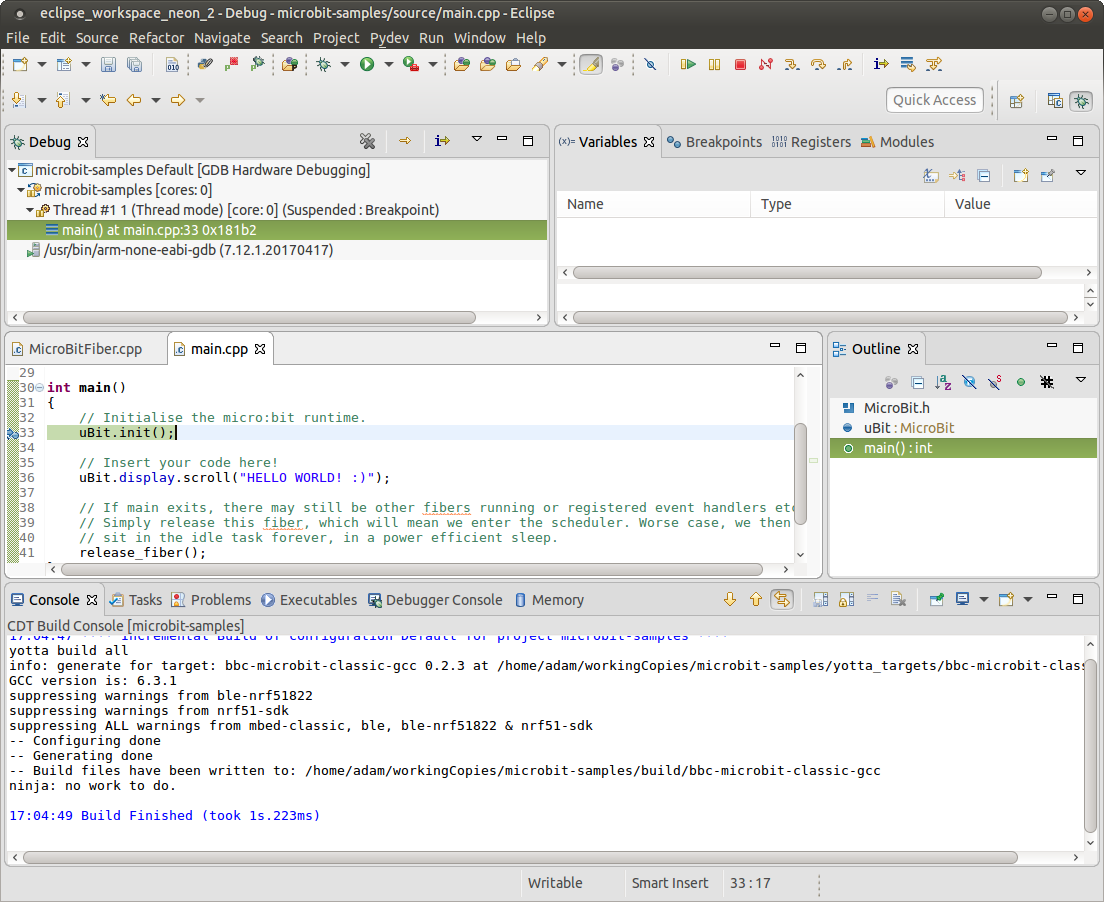
Pressing Debug buttons started a debug session, and I’ve landed in end of Init, then (after pressing Resume), in my main():

Let’s go into the uBit.init() call (with pressing F5). The Variables view gets populated and I can inspect all the members of MicroBit runtime object instance, and their inner members etc.
Putting new breakpoints, stopping at them, and inspecting other elements works as expected.
OK, short debugging session for our tiny little friendly device has been completed, with a sense of achievement ;)